Day 1: Introduction to R Statistical Analysis Software
Summer 2025
Rstudio
- What is it?
- Create New R code File
- Change the theme (Optional)
- Multiple panes (Optional)
- Command Palette (Optional)
You can use app to write and run R codes, but it has a terrible graphic user interface.
Rstudio is an Integrated Development Environment. It provides a user-friendly interface to write and run R code, view plots, and manage files.
You must install R (the engine) before you can use RStudio!
R studio looks like this:

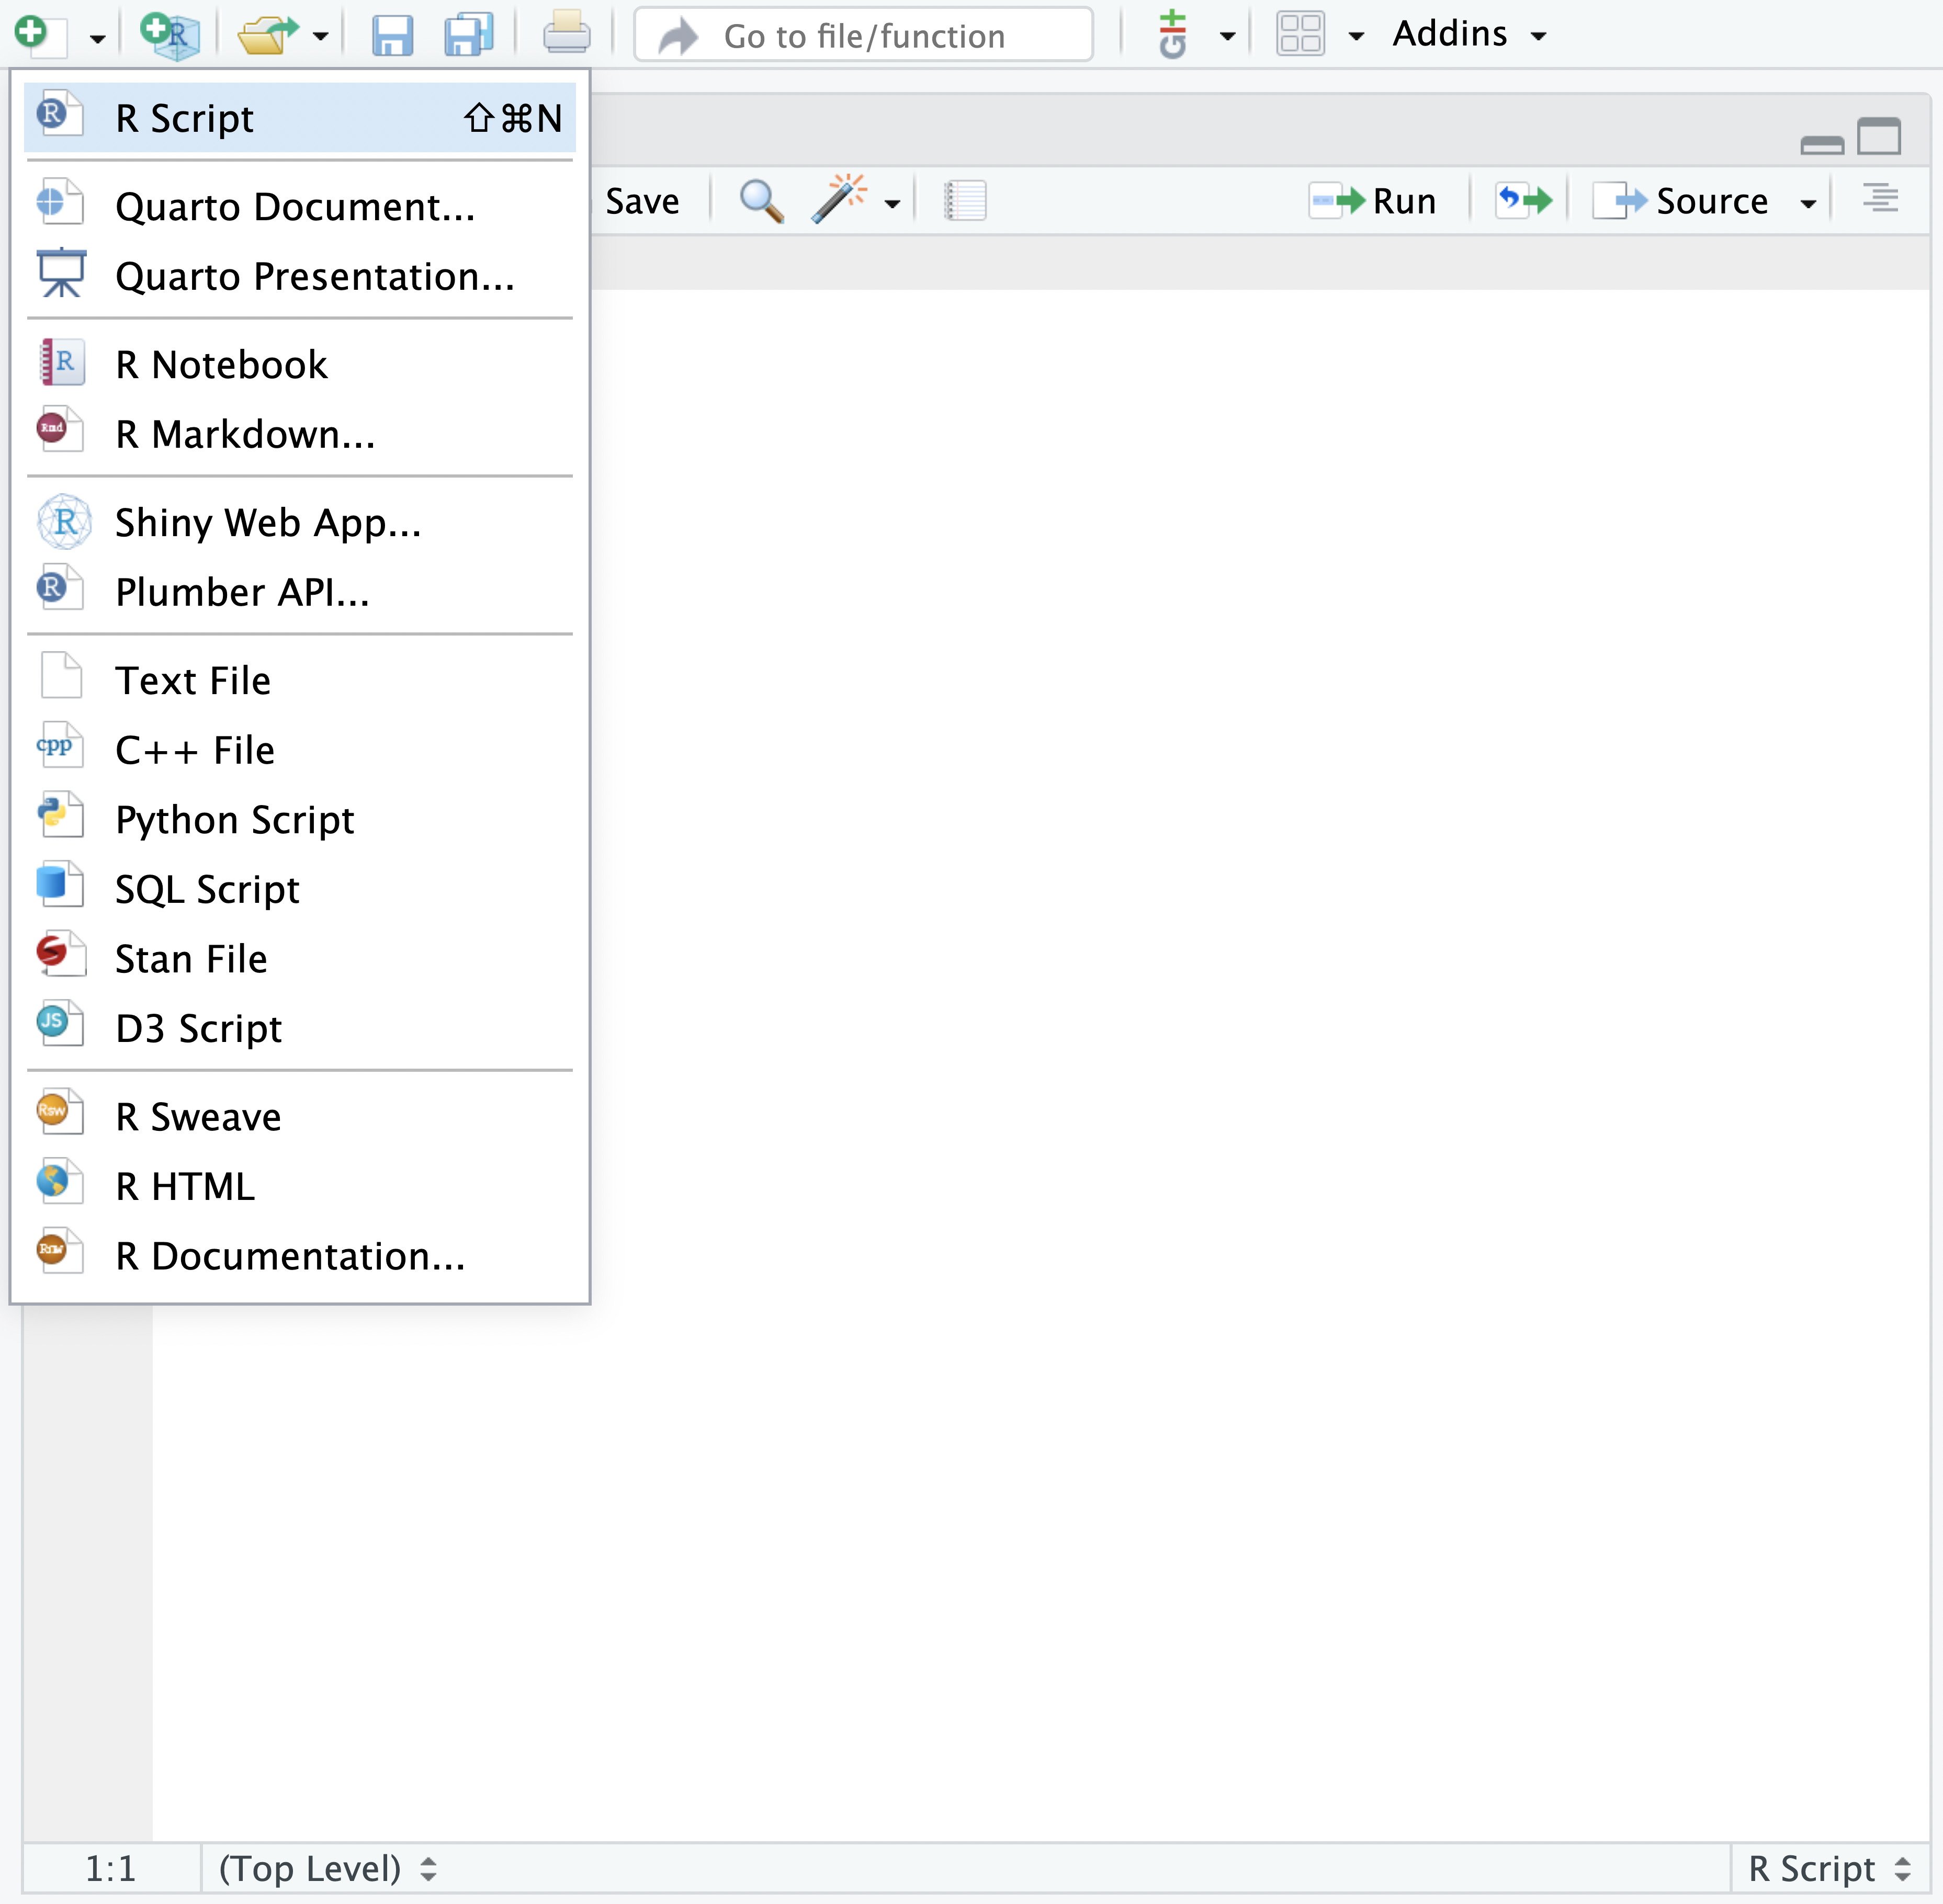
To create new R script file, click the
+button on the top-left corner of the Rstudio, or hitCtrl+Shift+N(Cmd+Shift+Non mac).To save the file, click the floppy disk icon , or
Ctrl+S(Cmd+Son macOS).
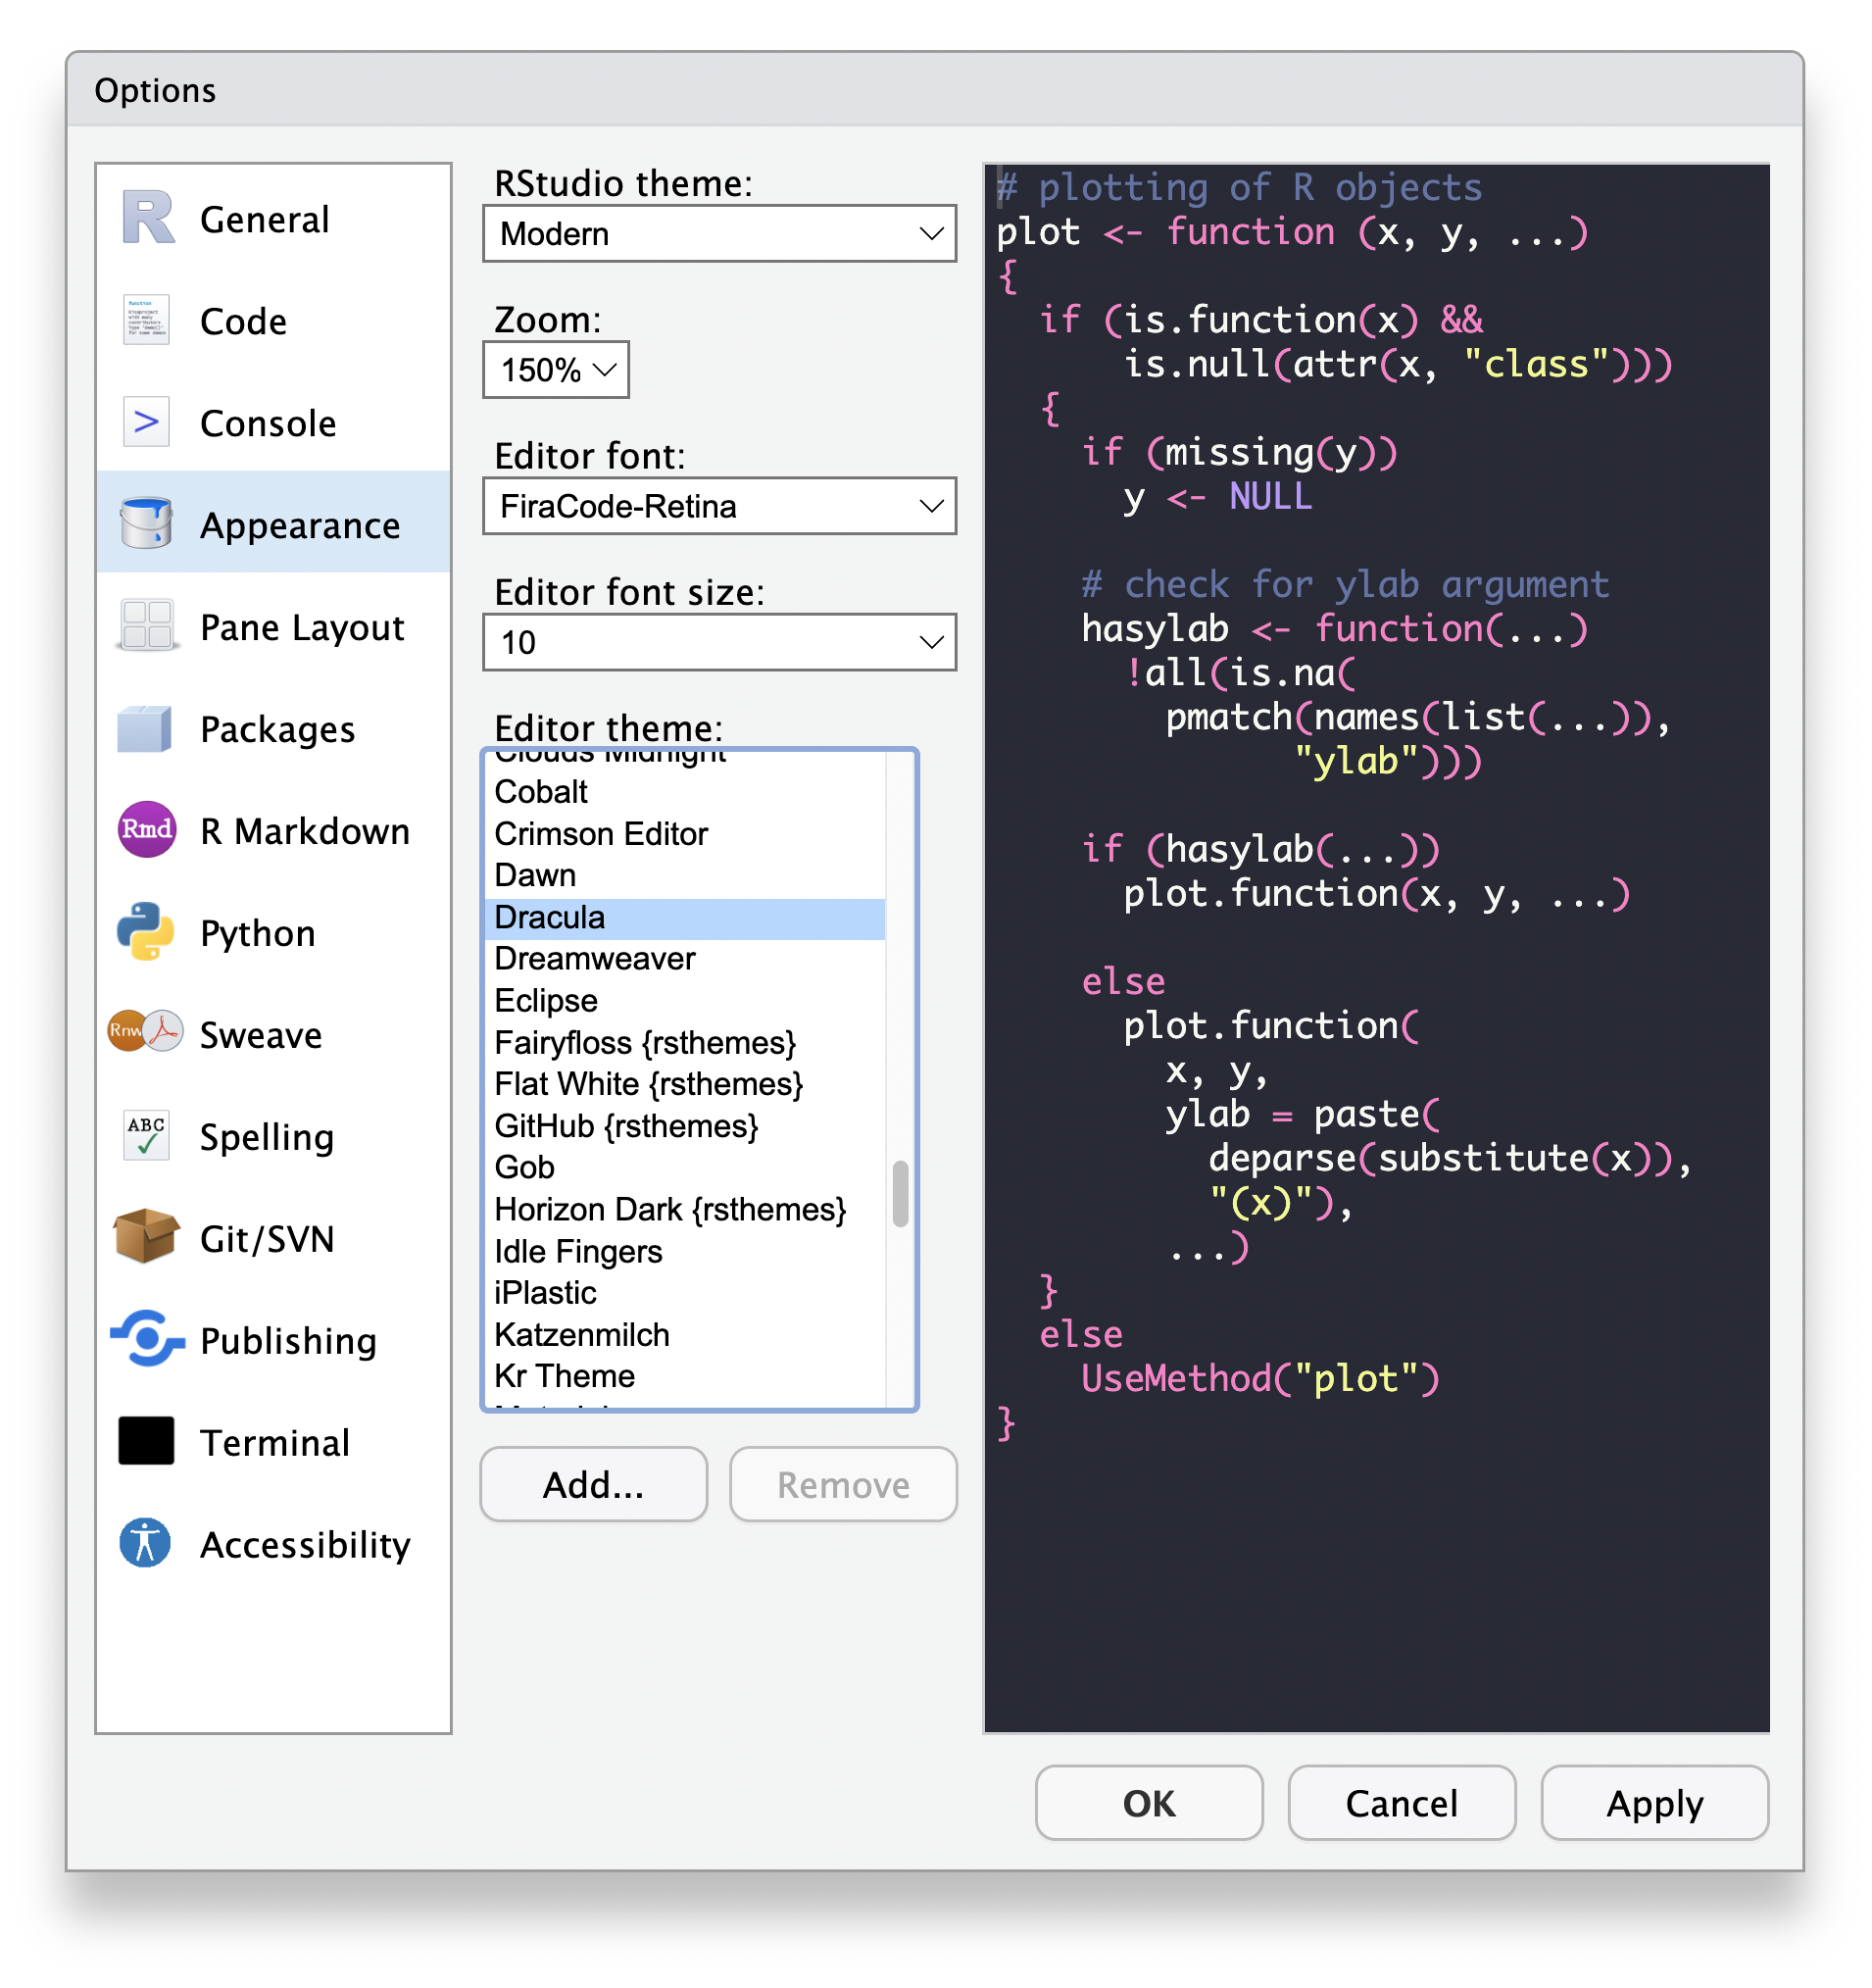
- You can change the appearance of Rstudio by going to
Tools->Global Options->Appearance->Editor themeand select your favorite theme.
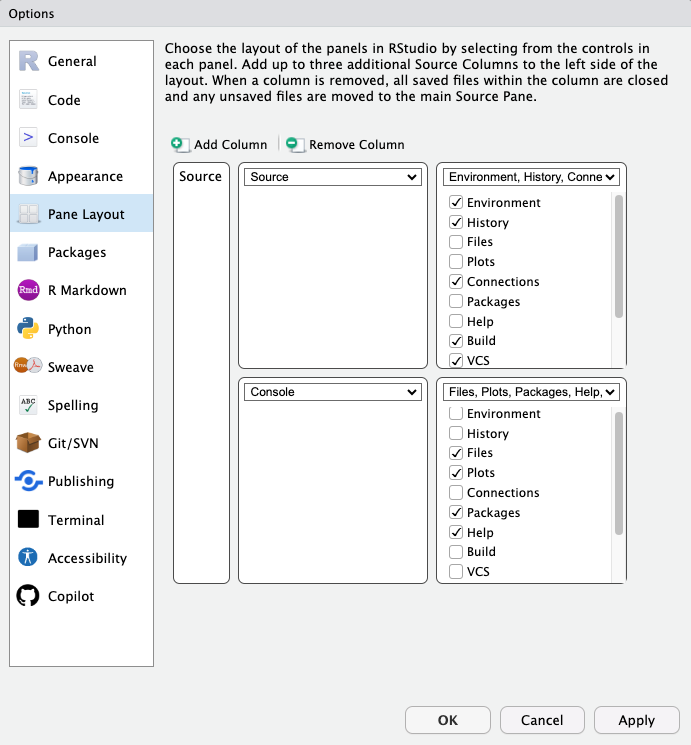
- You can have multiple code panes in Rstudio.
- To create a new pane, go to
Tools->Global Options->Pane Layout->Add Column.
- In the same window, you can also change the layout of the panes.
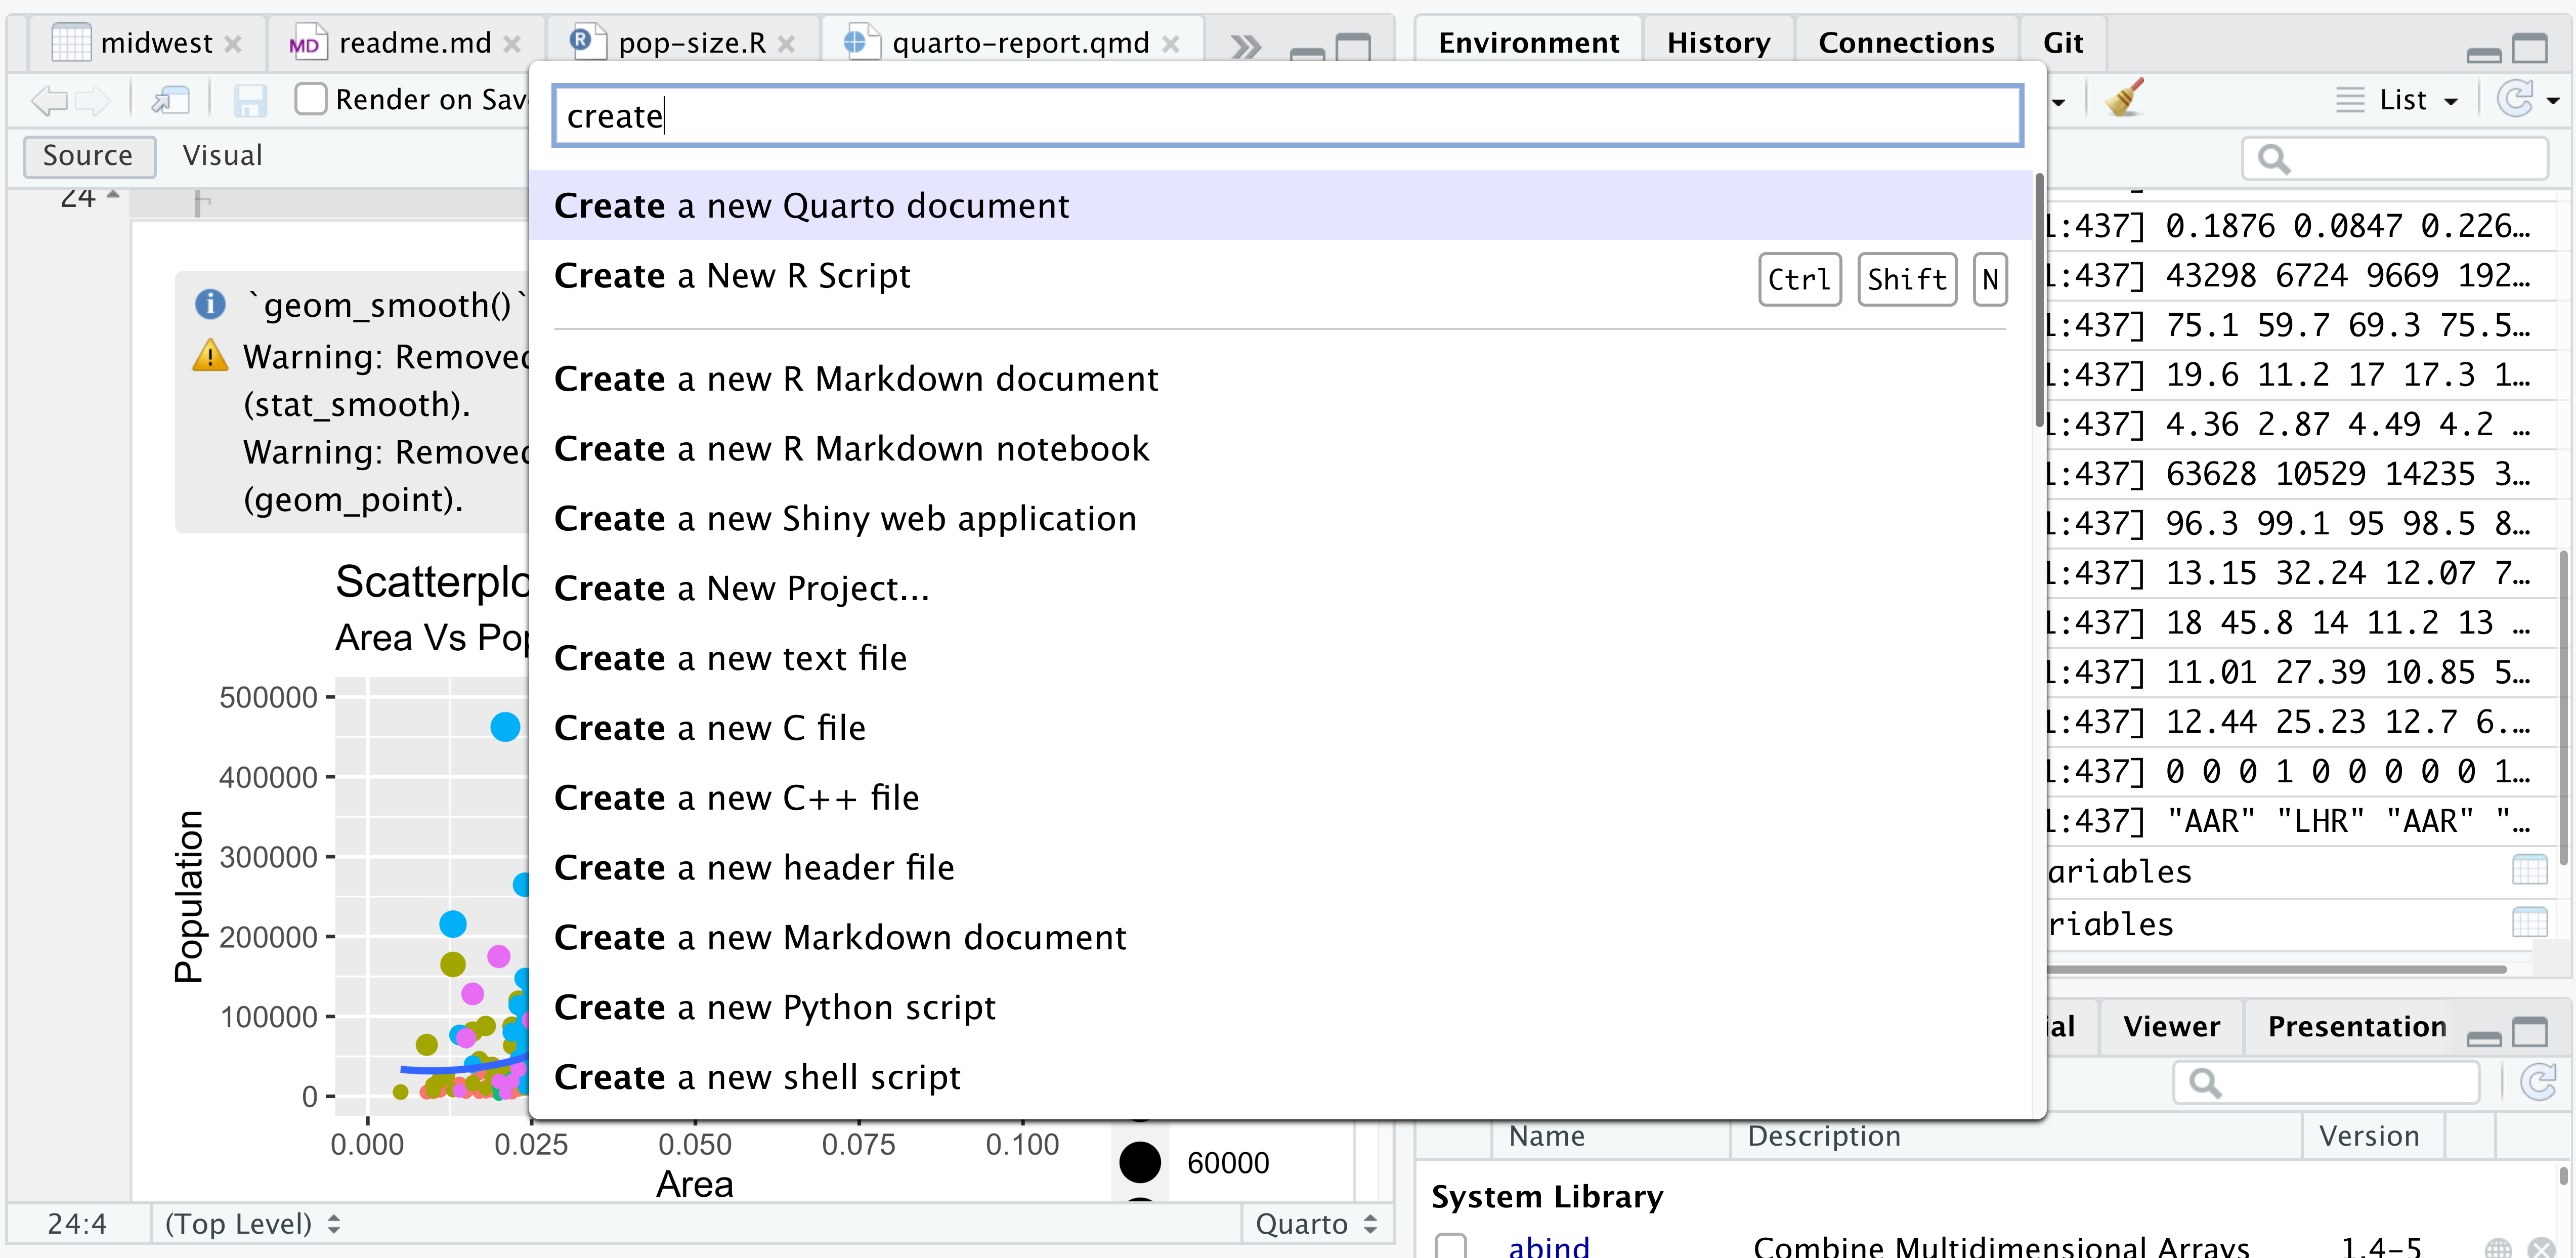
Recent R-studio has a new feature called “Command Palette.”
Hit
Ctrl+Shift+P(Cmd+Shift+Pon macOS) on your keyboard, or go toTools->Show Command Palette.From here, you can search for and do almost anything: create new files, open projects, etc.